Although the codyn modeling language is powerful, it can also be difficult to develop an intuition about the designed networks, especially when not familiar with codyn. The codyn studio is a convenient tool designed specifically for educational purposes and for quick experimentation with existing networks.
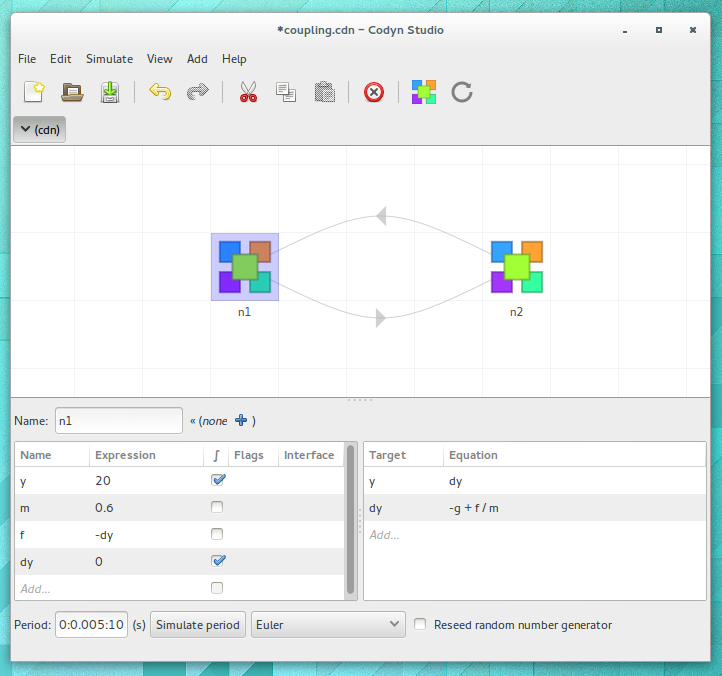
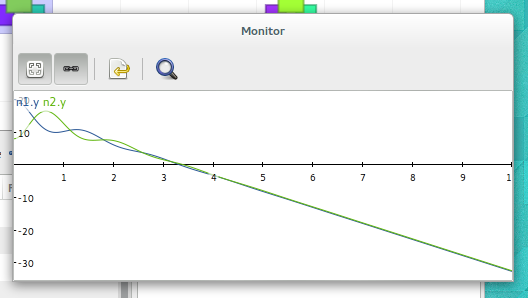
The codyn studio is a simple, graphical user interface which shows a graphical representation of a network on a canvas. Nodes are represented by simple blocks, while edges are represented by arrows between node blocks. Opening a network in the studio allows you to easily see the underlying structure that was designed. At the same time, it is easy to quickly forward integrate the network while monitoring any variables of the network. These monitored variables are plotted and shown for visual inspection.
Furthermore, the studio also allows for graphical manipulation of the network, adding and removing nodes, adding new edges and modifying variables. This makes it very easy to quickly try out new ideas of get an intuitive of how a dynamical system reacts to a change in variables.